The recently published study summarizes and analyzes GameFi industry data from the first quarter of 2022. It includes the overall and individual chain performance, as well as GameFi token liquidity and fundraising analysis. The report has been jointly published by Footprint Analytics and DeGame.
The teams found out GameFi faced an increase in popularity and funding in January 2022, with a downward spiral starting in February and solidifying in April. In March 2022, the industry began to rise up again, but we’re likely to see a new downfall due to the recent crypto market crash.
In Q1 2022, the trading overall trading volume in blockchain gaming was $6.322B, of which Harmony accounted for 48.58%, Ronin 26.85%, and BSC 14.25%. The high trading volume on Harmony is due to the hit gamified DeFi game, Defi Kingdoms.
The total number of players remains around 1.2M, similar to Q4 2021. Most new players (28.83%) joined in on the WAX blockchain.
The transaction volume is linked to the number of players on the chain, but WAX significantly tops the chart (77.7%) with a similar number of players on HIVE (28.55%). This could indicate players in WAX-run games are more active and have a higher retention rate. Alien Worlds account for 57% of the transactions on WAX.
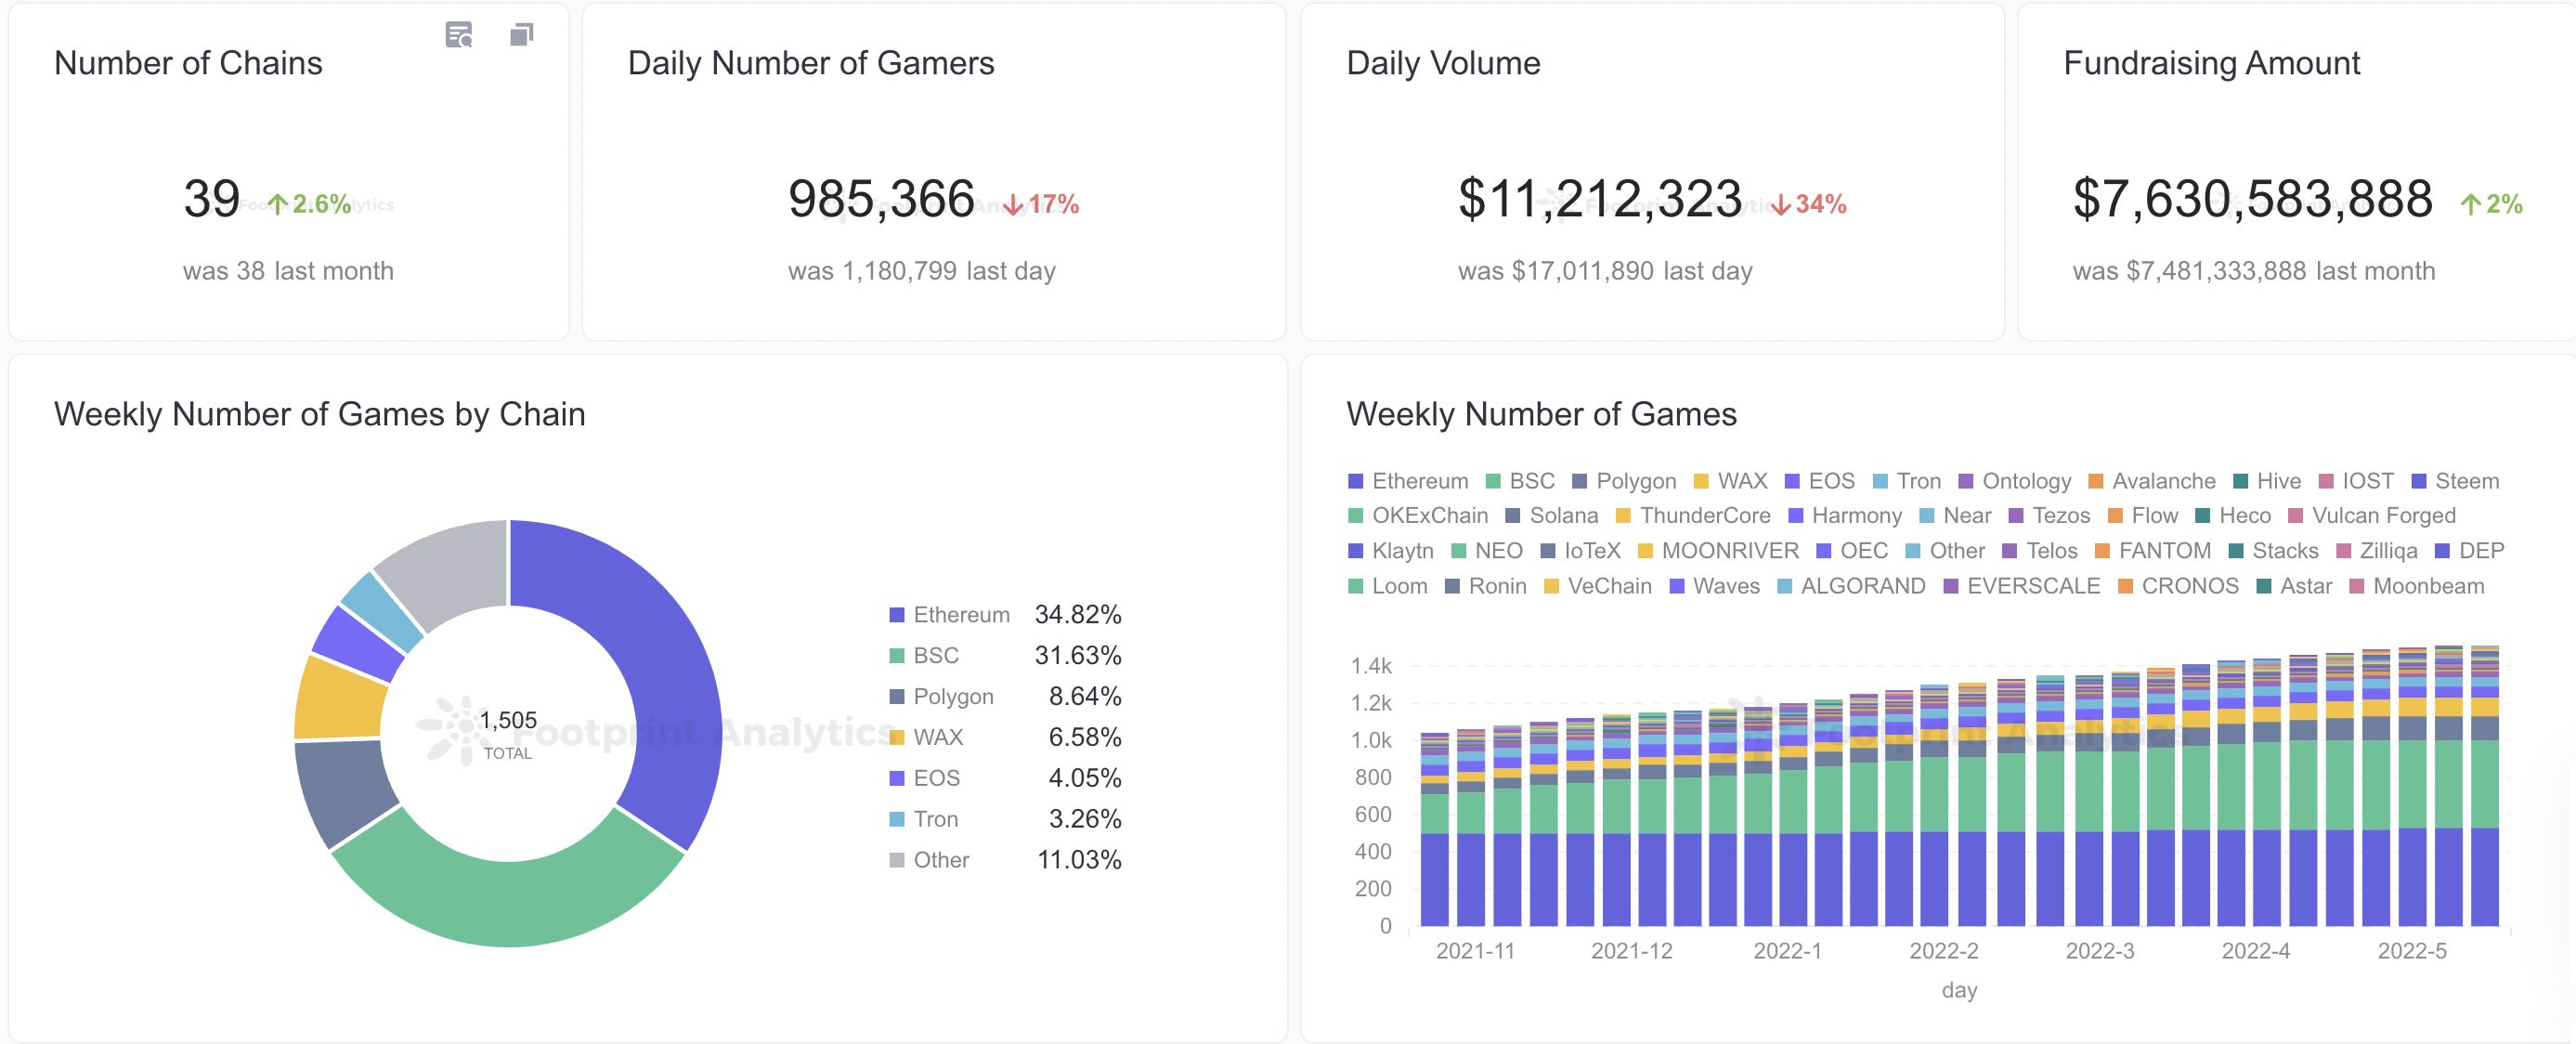
A total of 1,424 games were scouted by the teams, a slight increase from 1,200 in Q4 2021. On most CEXs, 20-30% of newly listed tokens are from GameFi projects, and GameFi projects average a daily trading volume of $100,000. The distribution of the trading volume is extremely uneven, hence averages can be misleading.
You can download the full report here, and monitor the GameFi overview 24/7 on the live graphs on the Footprint Analytics website.
Wax Leads the Way in Number of Players
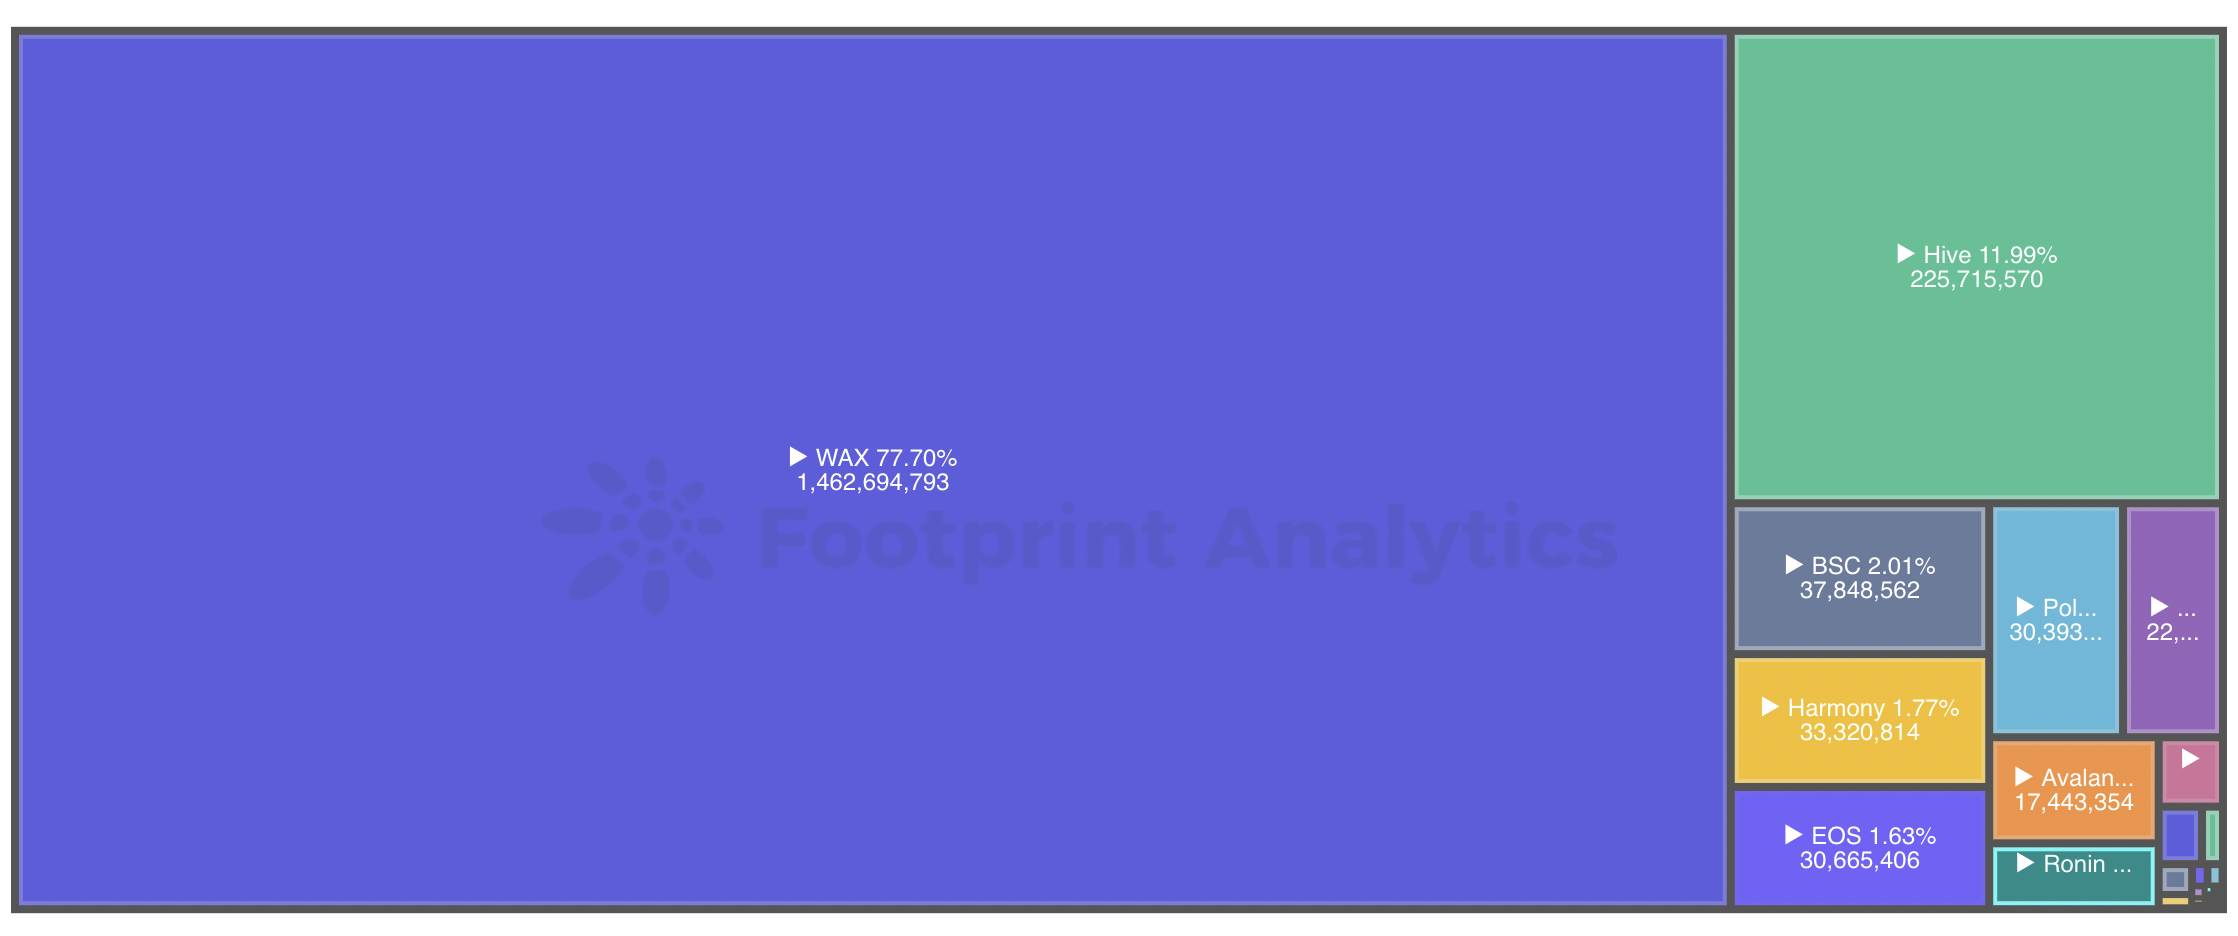
The WAX blockchain is the host of two hits in the blockchain gaming industry: Alien Worlds and Farmers World, which combined makeup 92.52% of the transactions on the chain.
The second biggest chain by players is HIVE, mostly known for Splinterlands. The game totals 99.5% of the transactions on the chain.
BSC is getting noticed by game devs, and while it gets a smaller market share, it’s the chain with the most diverse ecosystem of games. MOBOX, Second Live, Bomb Crypto, X World Games, and Elfin Kingdom are the biggest titles by player base. While Bomb Crypto takes home 29.2% of the transactions on the chain. MOBOX only receives 10.3%.
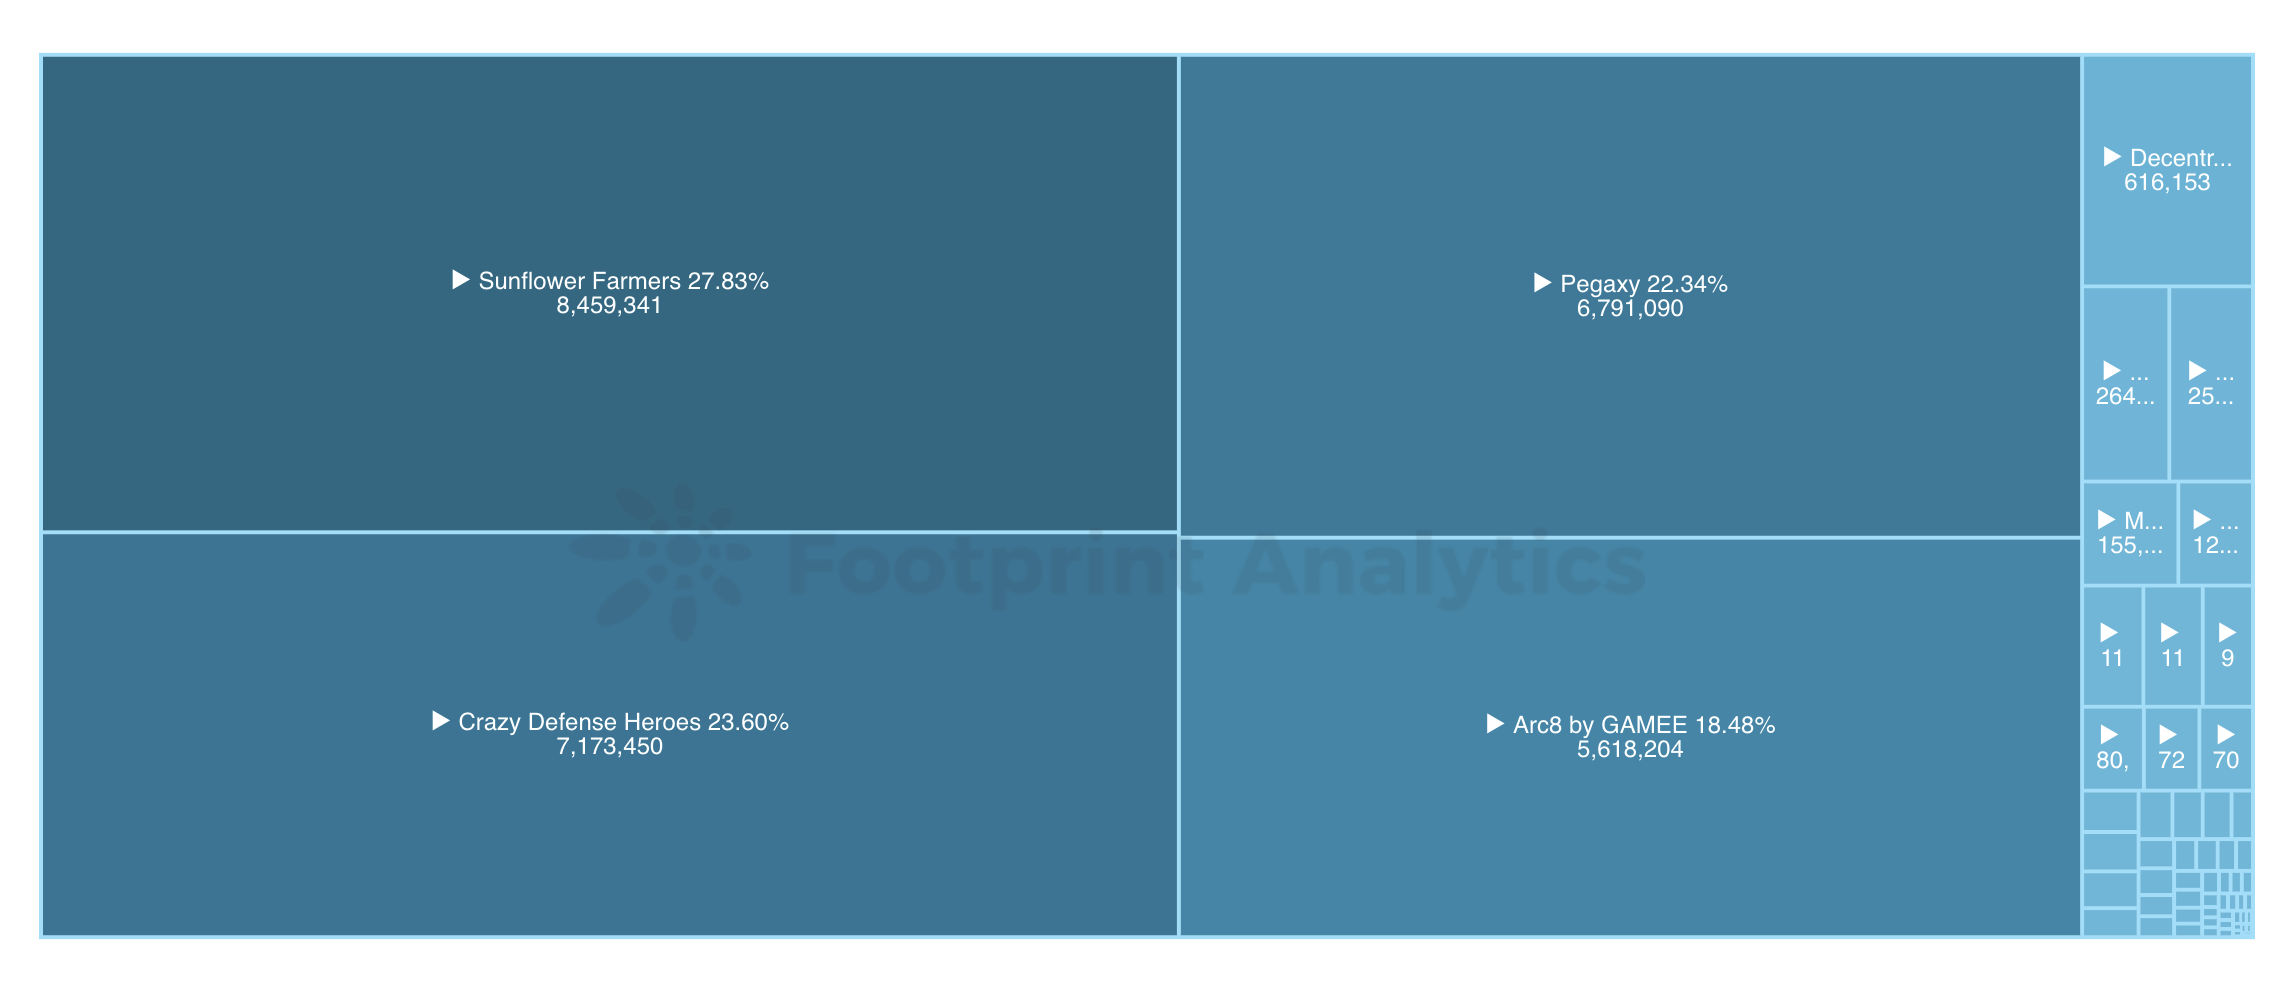
Over 50% of players on the Polygon Chain are playing Crazy Defense Heroes, the hit supported by Animoca Brands. However, Sunflower Land is the golden egg taking home 27.83% of transactions.
EOS is growing rapidly thanks to Upland, which represent 94.13% of gamers on-chain and 85.06% of transactions. PROSPECTORS rank second with 3.68% of the player base and 7.38% of the transactions.
On the Ronin blockchain, Axie Infinity obviously takes 100% of the pie, being the only relevant title published on it.
Avalanche is also disproportionately used by one project only. Crabada accounts for 70.81% of the player base and 98.29% of the transactions. Pizza Game (15.02%) and Yield Hunt (10.89%) also have some players, but the transaction volume for each is negligible.
GameFi Platforms Raise an Average of $20.4M
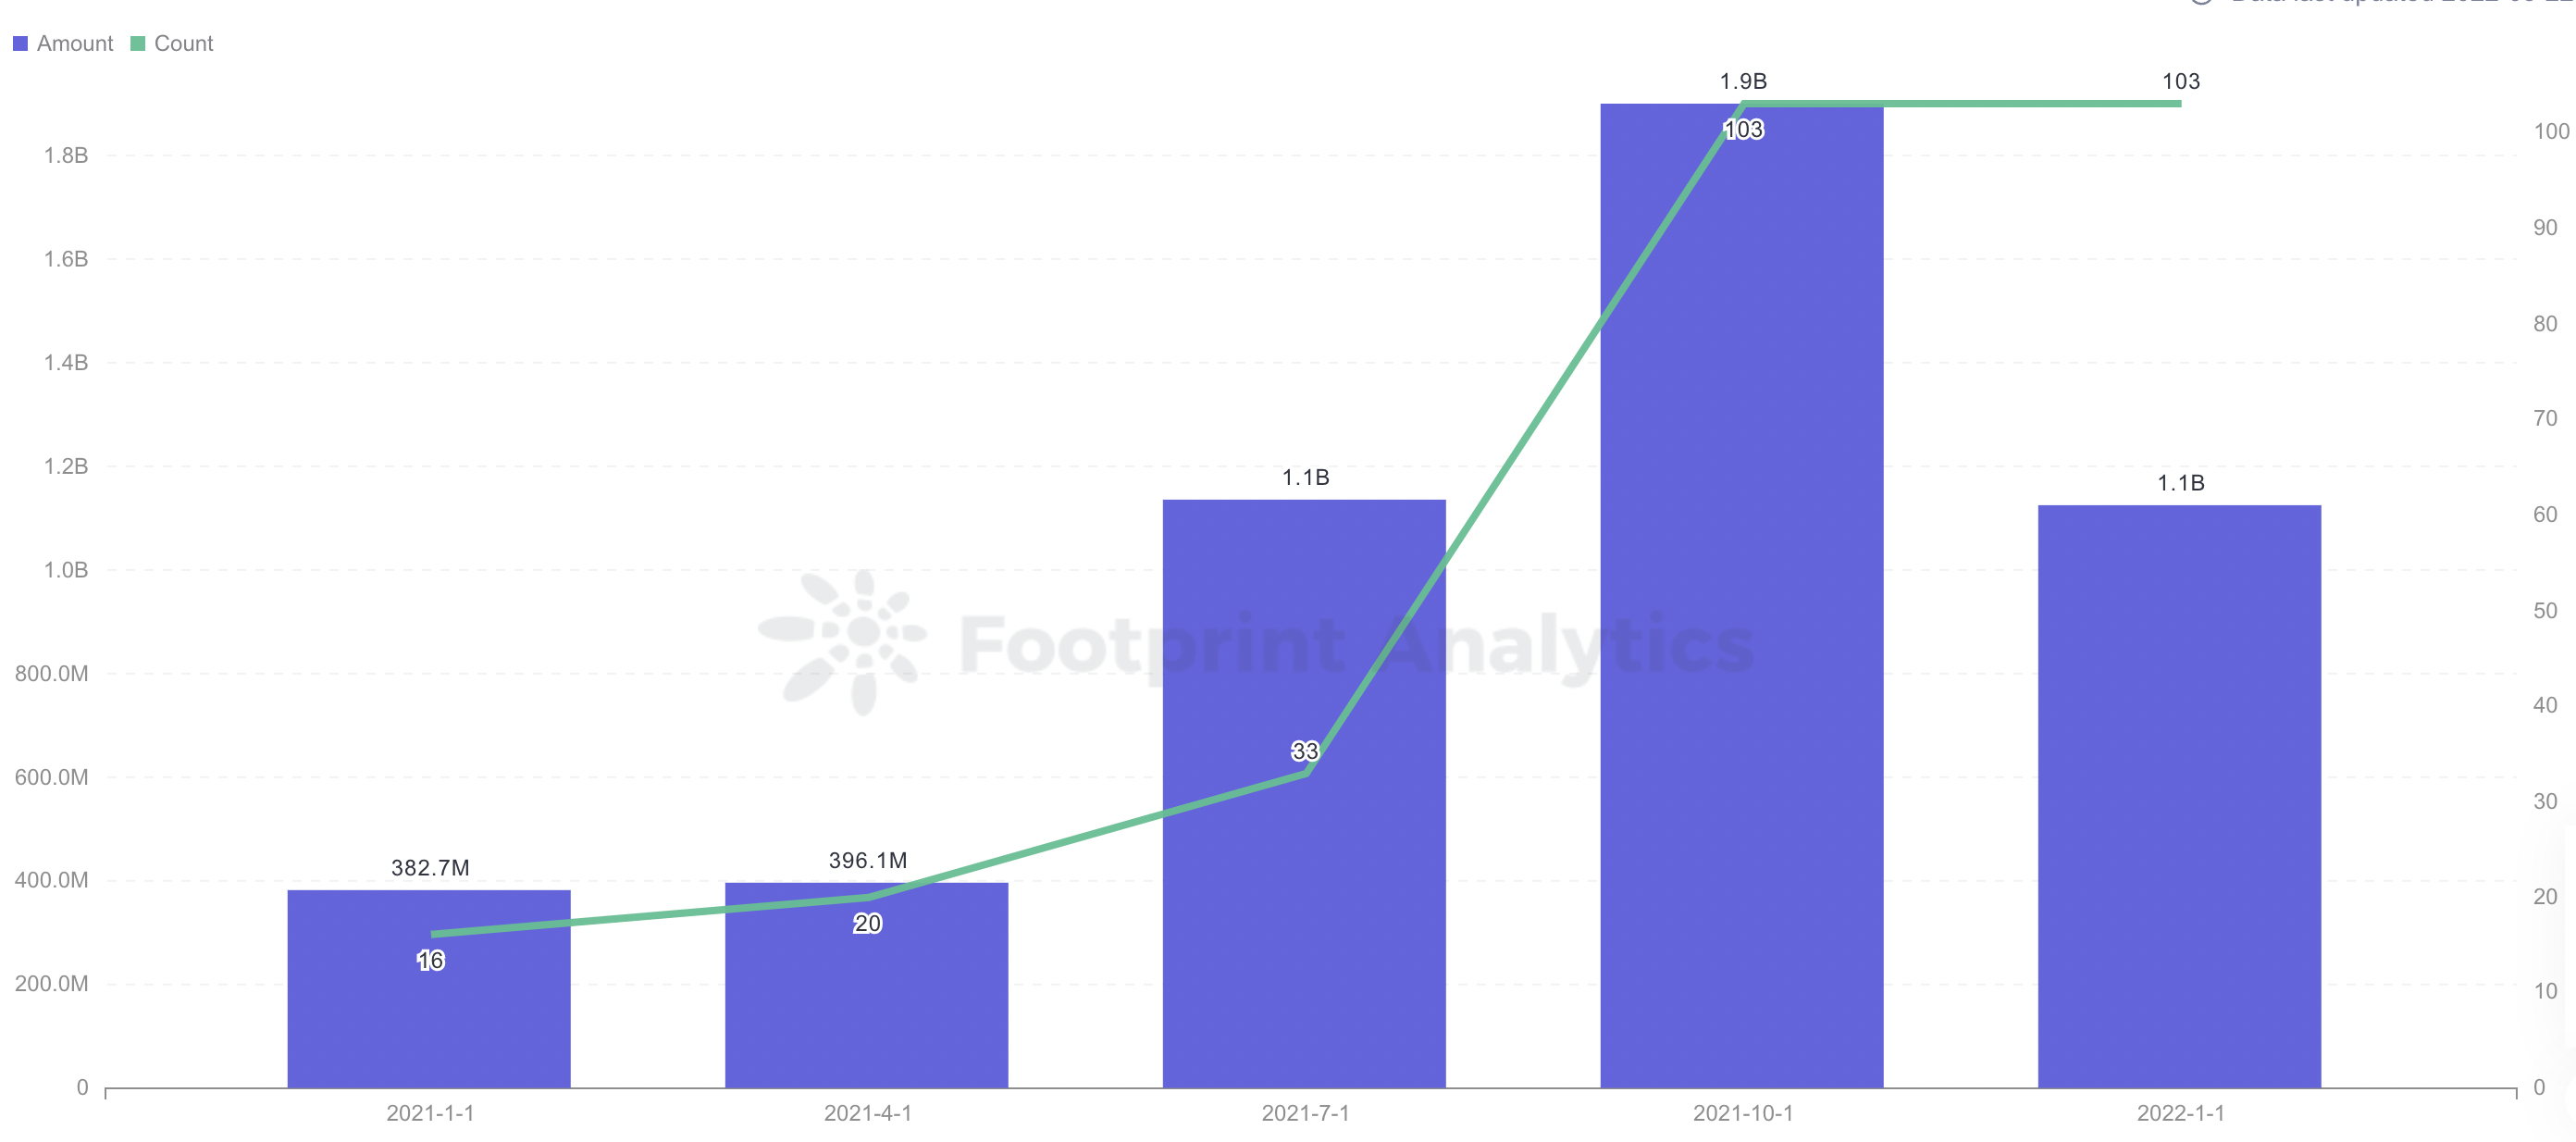
GameFi funding increased 194.19% year-over-year and decreased 40.78% season-over-season. Overall, GameFi projects raised $1.126B.
Independent games got the most rounds, followed by guilds and DAOs that were funded, mainly in the seed round. Polygon is the chain with the highest number of independent game projects with funding and the highest amount of fundraising.
Unsurprisingly, Animoca Brands was the most active investment institution this quarter, which probably helped them reach the unicorn status ($1bln evaluation) in May 2022. Other notable investors for the quarter are Binance Labs (6 investments), and A16z (3 investments).
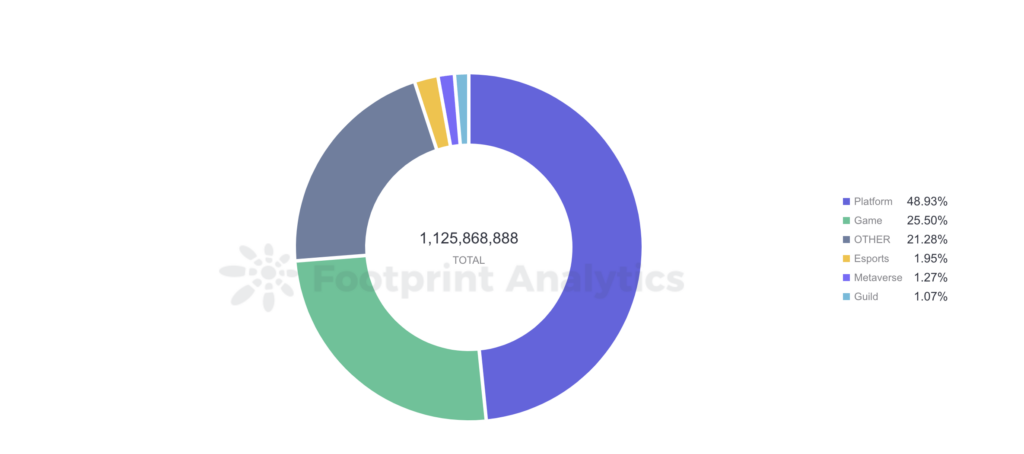
The top 2 types of projects receiving the most funds are game platforms, for a total of $551m (48.93%), and independent games, $287m (25.5%). Metaverse projects are rising, but they’re currently receiving only 1.27% of the pie.
GameFi platforms typically raise significantly higher amounts than single gaming projects. Platforms received an average of $20.4m, while games only got $4.55m.
About DeGame and Footprint Analytics
DeGame is a leading NFT game platform launched by L2Y, a Singapore-based blockchain company. With DeGame, players can discover, download, and review the most exciting new NFT games in one place, and investors can have access to unique market insights on token & NFT price and in-game data.
As of now, DeGame provides data on 1182 games, 442 tokens, 57 game chains, 50 Guilds, and is home to 200,000+ registered users.

Footprint Analytics is an analysis platform to discover and visualize blockchain data. No coding is required to access the datasets, and it supports cross-chain data.
With special regard to GameFi (see all the stats here), Footprint Analytics includes 3,000+ Dashboards, 11,000+ Charts, and 35,000+ Tags in its database, making it the most comprehensive analytical tool for entrepreneurs and marketers in the GameFi space.


